
How to Use Learning Analytics Reports
All of the reports below are in the Evaluation Section of Subject Management. It is on the left-hand navigation menu of the vUWS site. Expand the Evaluation section in Subject Management and a number of sub-folders and reports are present.
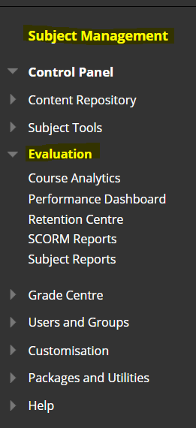
Course Analytics
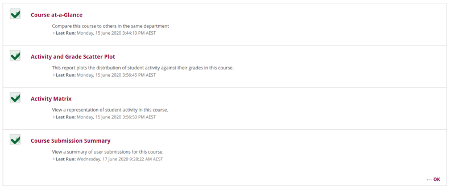
Course Analytics has four reports within it. All of the reports are directly executable (which means you don’t need to supply any parameters).
Simply click on them to get the report.
- Course (Unit) At A Glance: unit summary report along with comparison against school
- Activity and Grade Scatter Plot: a scatter plot of grades against course access
- Activity Matrix: a matrix of students in terms of the decile of interactions and grade
- Course Submission Summary: a summary report focusing on submission items
Performance Dashboard
The performance dashboard is the second tab in the Evaluation section. It has links to data about student access, discussion boards, retention centre data and grades. It is downloadable using a printer icon on the top right corner.
Retention Centre
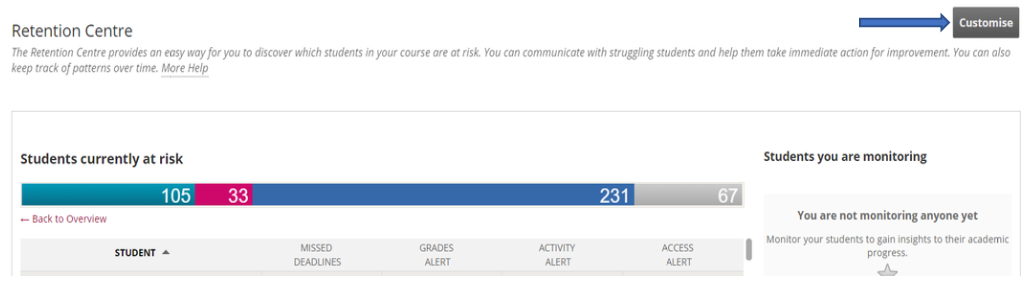
Retention Centre is a report to identify students who might be at risk in your cohort. It focuses on four main parameters (by default) to find at-risk students. The parameters can be tuned to fit your context and to identify students who might be struggling. To launch the retention centre, click on Retention Centre link in the Evaluation Section.
Customising Retention Centre
There is a tab just above Retention Centre on the right-hand side which allows you to ‘Customise’ the Retention Centre
This opens a new window which shows the four risk parameters and their criteria
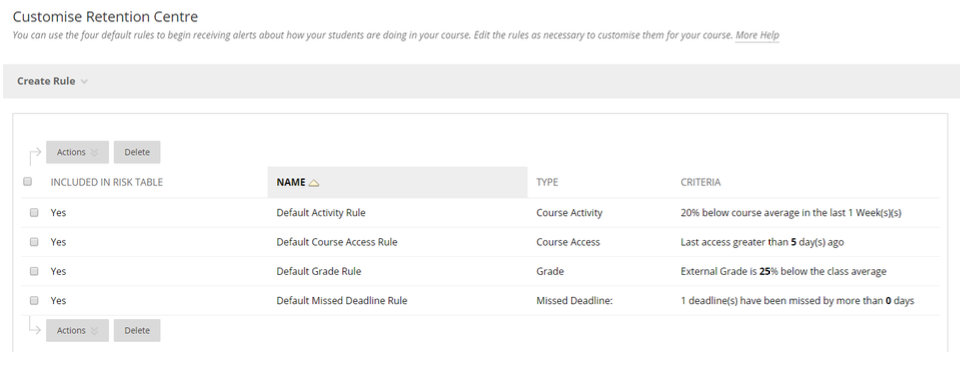
When hovering over the name of a rule, there is a drop-down button with an option to edit the risk parameter
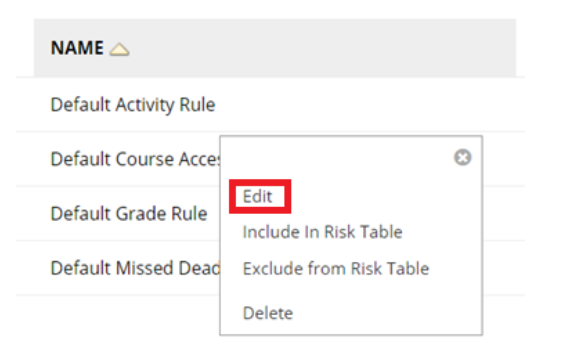
Click on Edit to open the customisation dialog box.
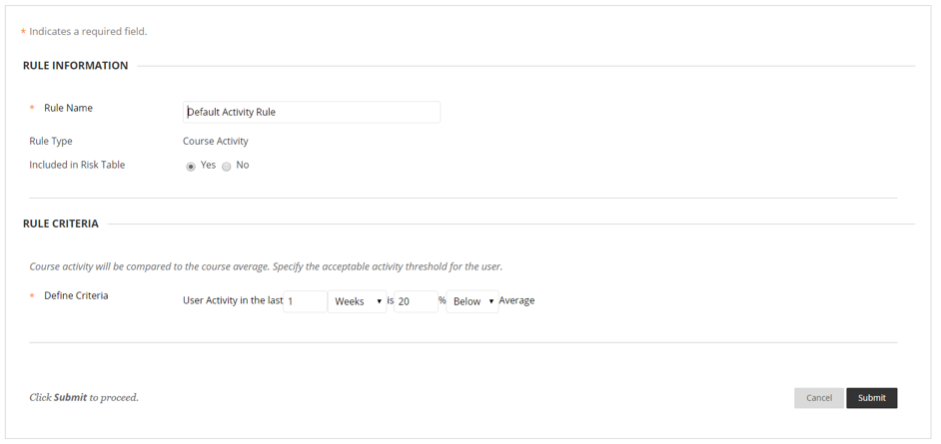
You can rename the rule, choose to include it as a risk parameter or not and define the criteria of the rule. In this instance, since the 20% below activity rule is set, if a unit has 100 interactions (average) in the past week and a student has interacted 79 times, then the student would be flagged as an “at risk” student. You can also change the window of interaction.
Once the Submit button is pressed, the changes are reflected in the retention centre.
Monitoring of students can be done from the retention centre table itself. Each student’s name is clickable and this opens a dialog box for that individual student risk profile.
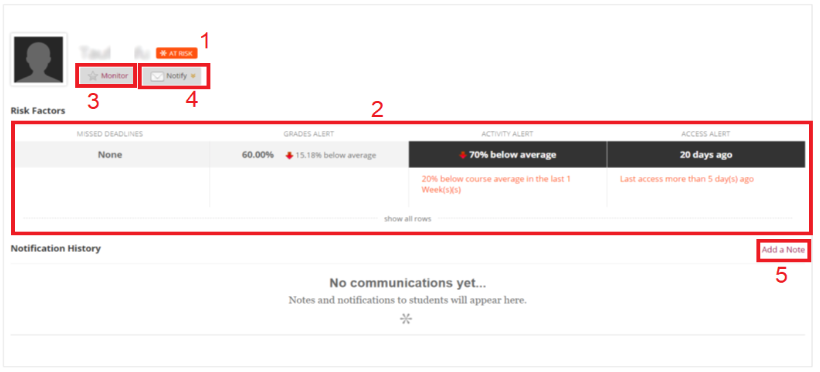
There are four ways this can be used:
- Why the student is at risk . For this example: The student is at risk because s/he hasn’t accessed course for 20 days and also interactions are 70% below the course average in the last week. Although the grades are lower in par they are not values that would flag the student to be at risk with this dimension. Also, the student hasn’t missed any deadlines yet, which is why it is not flagged. Hence, only two of the four parameters indicate that the student is at risk.
- High risk students . if all four parameters are activated the student can be monitored. This can be done using the star symbol which goes golden brown when activated. The student will then appear in the right-hand side panel of the retention centre.
- Notification . It is also possible to notify the student regarding their risk status. This uses email service built in to vUWS to send notification.
- Direct communication is possible using the retention centre by adding a note to notify other instructors and/or students of their status. This is a bit more direct as it occurs within the retention centre without using email.
SCORM Reports
SCORM Reports are only available in the units which have SCORM packaged modules. These units use third party tools to create SCORM packages and are implemented in vUWS. To run these reports, click on SCORM Reports on the Evaluation Section. If the unit has SCORM modules, it will appear like this:
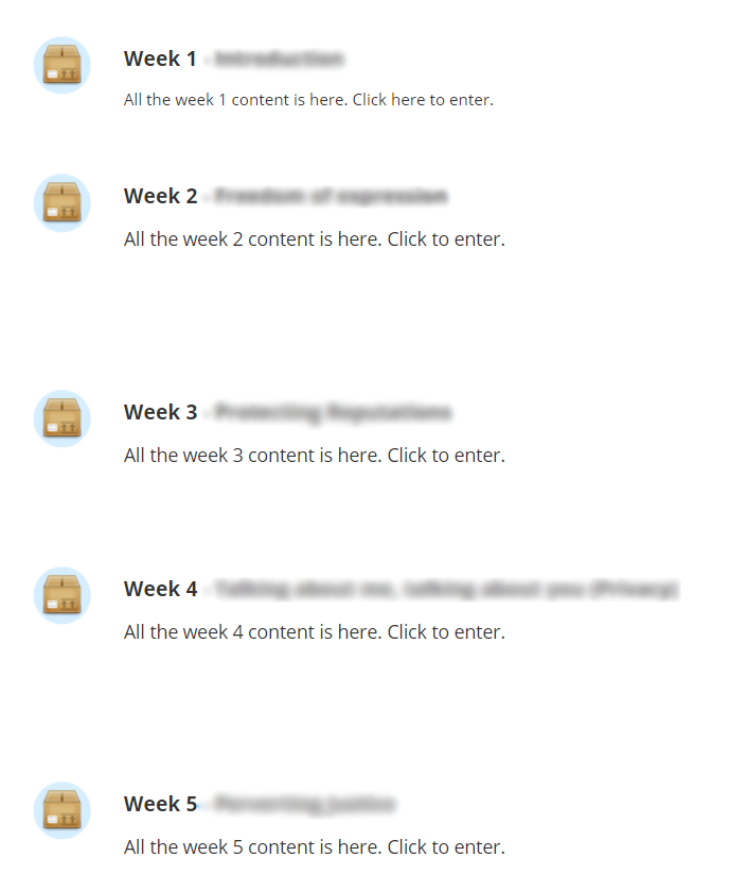
Hover over the Modules which is of interest and click drop down and hit Run
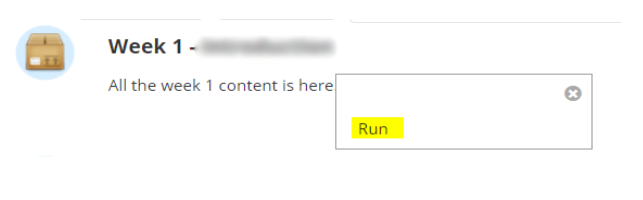
A dialog box appears where you can select one, any or all students. Click Ctrl + A to select all users (or click Select All) and then hit “>” symbol to confirm the selection and hit Submit
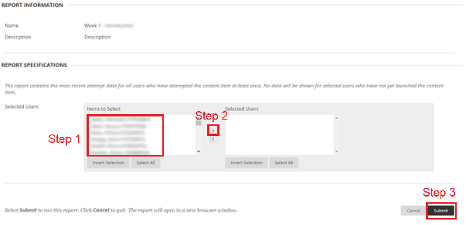
The result is an html document which can be copied and pasted in an excel sheet or a preferred format. To do this, simply do Ctrl + A, Ctrl + C, Ctrl + V from html to a preferred document.
Subject Reports
Subject Reports are the area specific reports and these show the detailed breakdown of activities in the different spaces of the vUWS site. This includes items, forums, groups, single user activity and entire unit breakdown.
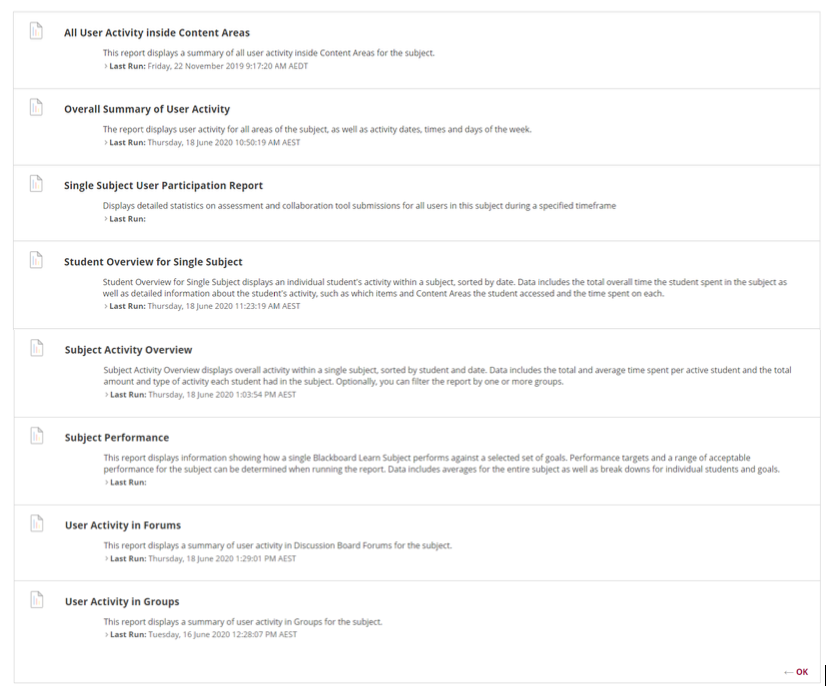
All User Activity inside Content Areas
The first report in Subject Reports is “All User Activity inside Content Area”. This only shows the breakdown of hits (accesses) in the Content Area of the site. Content Area is defined as the folders in the left-hand navigation menu. Anything above Course Management is considered a Content Area .
To run this report, hover over ‘All User Activity inside Content Areas’ and a drop down appears. Click the drop down and hit Run.
In the next page, select the format of the report, start and end date of the extract and select one, a few or all the students of interest. Simply click on any student and press Ctrl + A to select all the students. It is also suggested to use the PDF format for the reports that don’t need too many details (perhaps a publishing report) and the Excel format for the reports which might need data to be aggregated. Once the Submit button is pressed, the report is generated automatically.
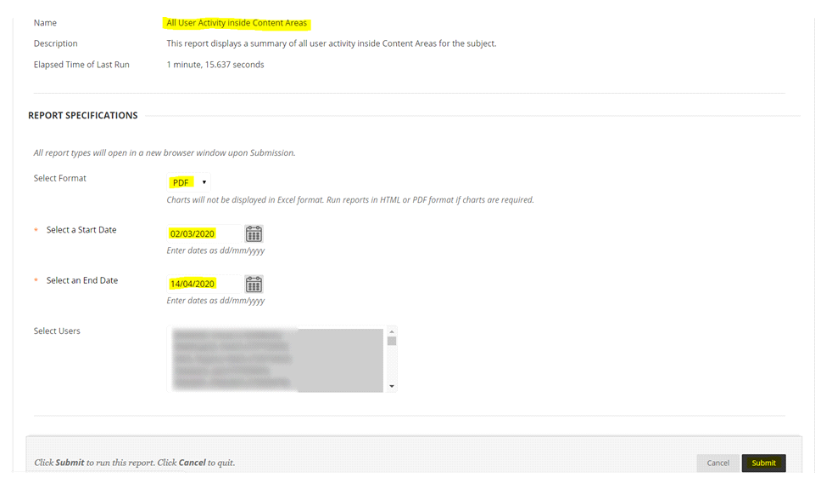
Note: Please note that the 180 days rule apply in this report. That is, the selection of the dates should be within the 180 days range from the date of run.
Overall Summary of User Activity
The second report in Subject Reports is “Overall Summary of User Activity”. This report shows the breakdown of hits (accesses) in all the areas of the vUWS sites. This includes a summary on all the areas of the subject along with a breakdown per student in those individual areas.
To run this report, hover over the report and a drop down appears. Click the drop down and hit Run.
In the next page, select the format of the report, start and end date of extract and select one, a few or all the students of interest. Simply click on any student and press Ctrl + A to select all the students. It is also suggested to use the PDF format for the reports that don’t need too many details (perhaps a publishing report) and the Excel format for the reports which might need data to be aggregated. Once the Submit button is pressed, the report is generated automatically.
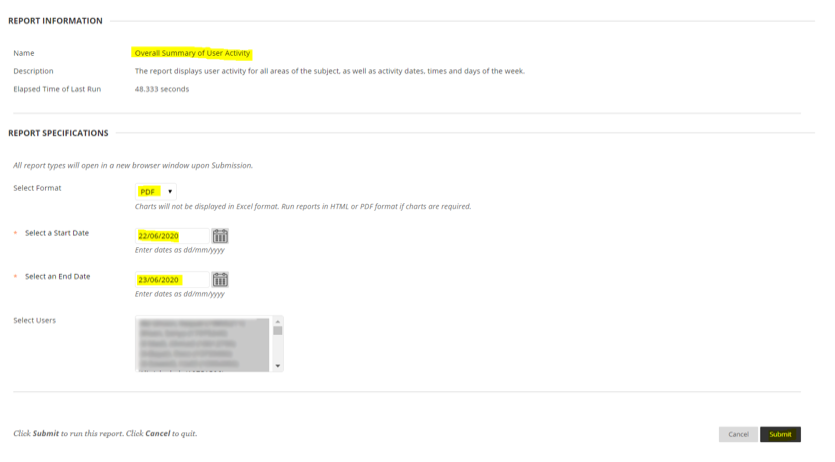
Note: Please note that the 180 days rule applies in this report. That is, the selection of the dates should be within the 180 days range from the date of the report run.
Single Subject User Participation Report
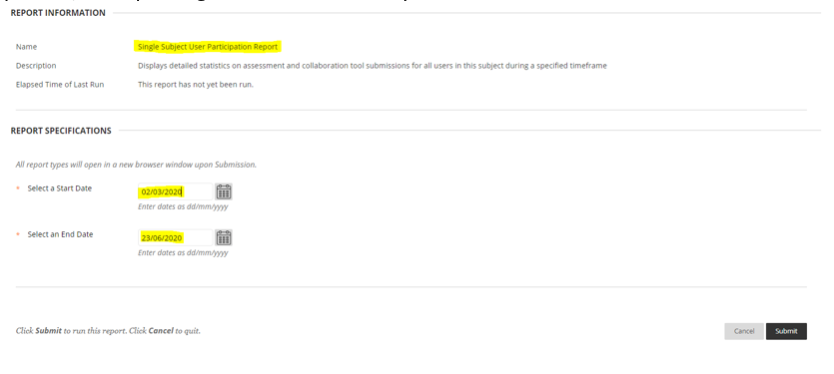
The third report in Subject Reports is “Single Subject User Participation Report”. The report is an Excel export which shows the student’s breakdown of submission and collaborative items in the site. This includes Test Submissions, Discussion Board Submissions, Blog Submissions, Journal Submissions, etc.
To run this report, hover over the report and a drop down appears. Click the drop down and hit Run. In the next page, select the start and end date of extract. Once the Submit button is pressed, the report is generated automatically.
Student Overview for Single Subject
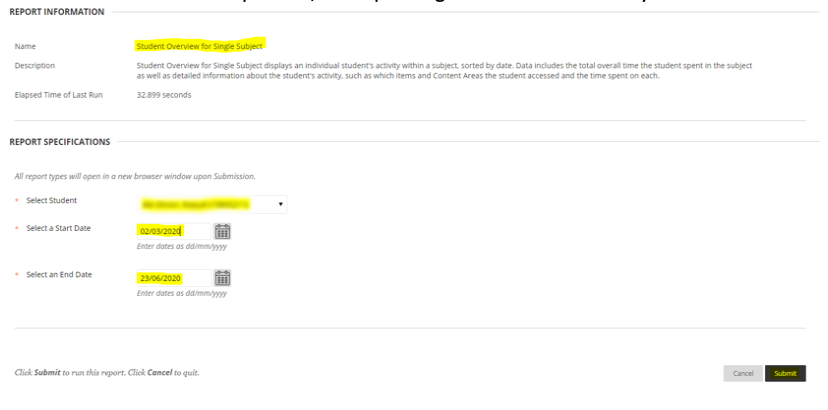
The fourth report in Subject Reports is “Student Overview for Single Subject”. This report shows the engagement of a single student in the course site. This includes breakdown by weekday on the amount of time spent on the site, comparison against the site, breakdown of items accessed by the student, etc.
To run this report, hover over the report and a drop down appears. Click the drop down and hit Run.
In the next page, select the start and end date of extract and select one student of interest. Once the Submit button is pressed, the report is generated automatically.
Subject Activity Overview
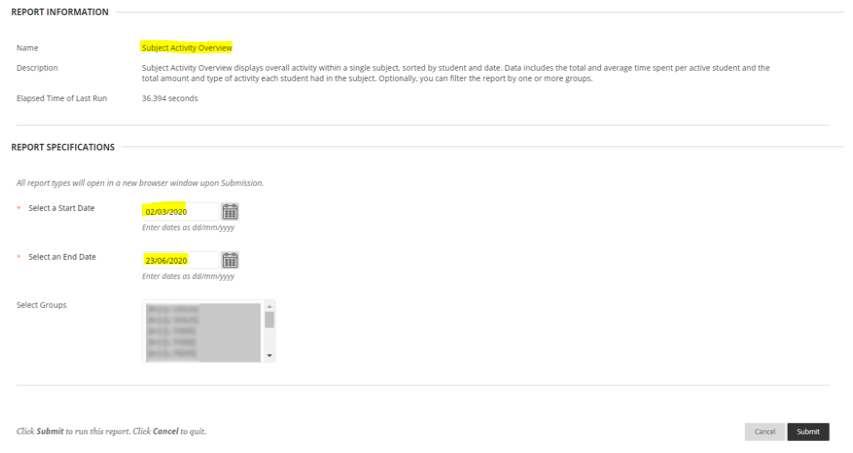
The fifth report in Subject Reports is “Subject Activity Overview”. This report shows the time (across various dimensions) spent by all the students in the course site. This includes breakdown across days of the week related to the amount of time spent on the site, breakdown by groups in vUWS as well as individual students, etc.
To run this report, hover over the report and a drop down appears. Click the drop down and hit Run.
In the next page, select the start and end date of extract and select one, a few or all the groups of interest. Simply click on any group and press Ctrl + A to select all the groups. Once the Submit button is pressed, the report is generated automatically.
Subject Performance
Subject Performance Report cannot be run as Western Sydney University doesn’t implement Goals which is implemented by aligning goals with items. This topic is outlined via Blackboard .
User Activity in Forums
The seventh report in Subject Reports is “User Activity in Forums”. This report shows the summaries for Accesses per Forum folders and also Messages (Threads) per Forum. In addition, there is also breakdown per student per forum in a matrix form.
To run this report, hover over the report and a drop down appears. Click the drop down and hit Run.
In the next page, select the format of the report, start and end date of extract and select one, a few or all the students of interest. Simply click on any student and press Ctrl + A to select all the students. It is also suggested to use the PDF format for the reports that don’t need too many details (perhaps a publishing report) and the Excel format for the reports which might need data to be aggregated. Once the Submit button is pressed, the report is generated automatically.
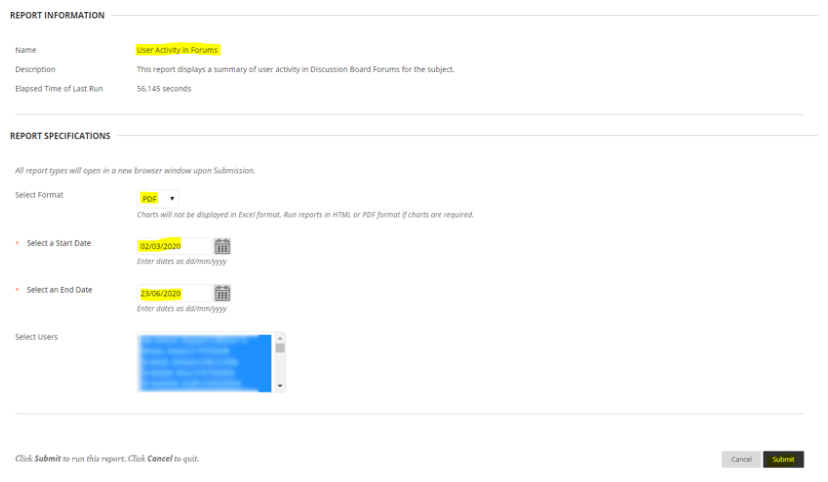
Note: Please note that the 180 days rule apply in this report. That is, the selection of the dates should be within the 180 days range from the date of run.
User Activity in Groups
The eighth and final report in Subject Reports is “User Activity in Groups”. The report provides information on the group related activities. It breaks down the hits (accesses) per group and also provides students accesses in their groups in a matrix format.
To run this report, hover over the report and a drop down appears. Click the drop down and hit Run.
In the next page, select the format of the report, start and end date of extract and select one, a few or all the students of interest. Simply click on any student and press Ctrl + A to select all the students. It is also suggested to use the PDF format for the reports that don’t need too many details (perhaps a publishing report) and the Excel format for the reports which might need data to be aggregated. Once the Submit button is pressed, the report is generated automatically.
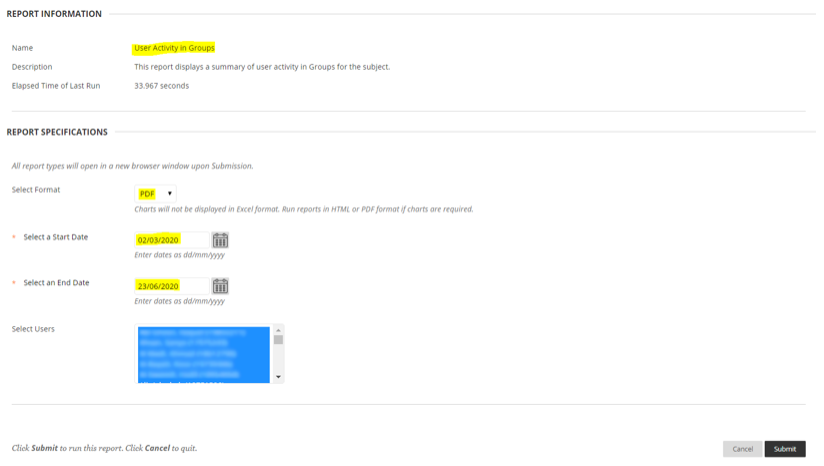
Note: Please note that the 180 days rule apply in this report. That is, the selection of the dates should be within the 180 days range from the date of run.
Individual Module Analysis
Apart from the standard Blackboard reports, there are a few reports which can be run outside of the Course Management Section. One such report is the analysis of the engagement of individual modules in the site. This report gives insights specific to the site and is therefore helpful if the intention is to compare and contrast student engagement levels between modules.
In order to run this, go to the location of the modules, ensure that the Edit Mode is Turned On (top right-hand corner) and hover over the module of interest. A small drop down appears, click on it to expand and select “View Statistics Report” to jump to the next section.
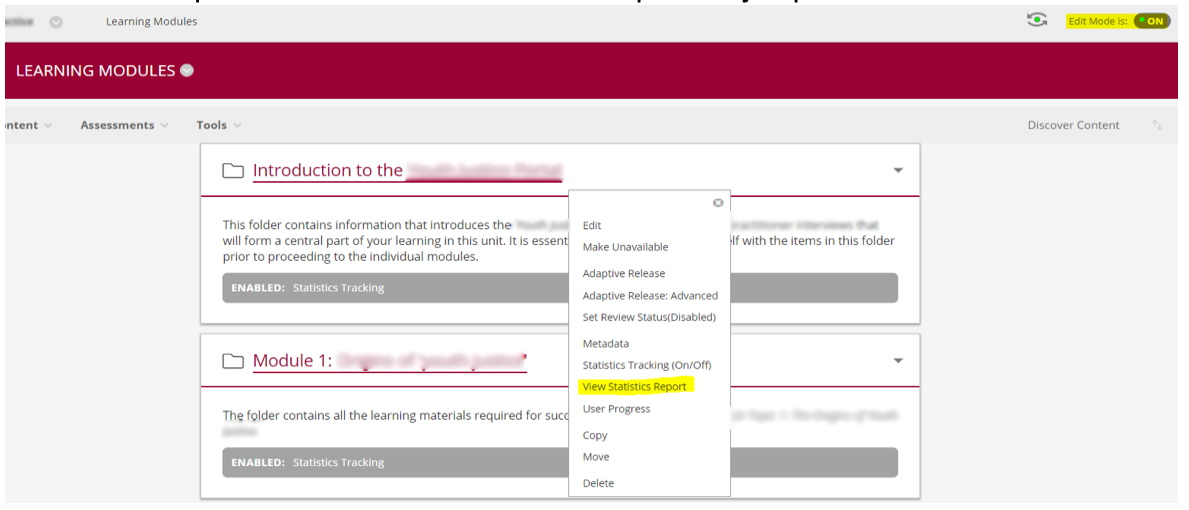
Another Subject Reports section appears with a single report titled “Content Usage Statistics”. Similarly, hover over it, click on the drop down and hit Run.

In the next page, select the format of the report, start and end date of extract and select one, a few or all the students of interest. Simply click on any student and press Ctrl + A to select all the students. It is also suggested to use the PDF format for the reports that don’t need too many details (perhaps a publishing report) and the Excel format for the reports which might need data to be aggregated. Once the Submit button is pressed, the report is generated automatically.
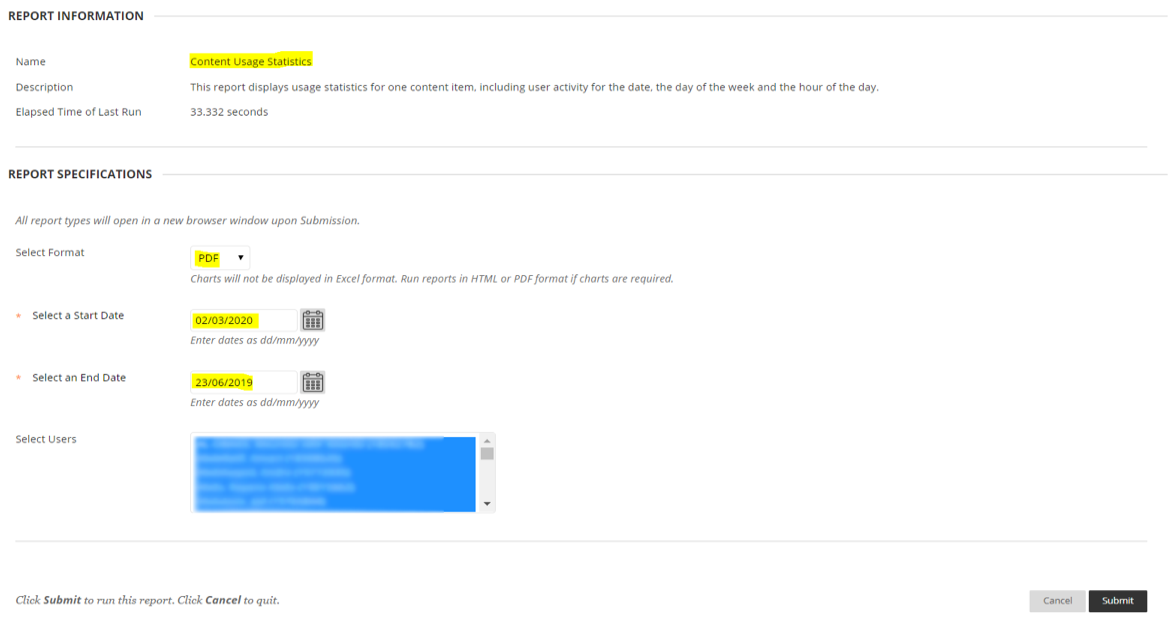
Note: Please note that the 180 days rule apply in this report. That is, the selection of the dates should be within the 180 days range from the date of run.
How do I start tracking student access and interaction in vUWS?
This module will provide you with all the basic information about the tools that are available in vUWS to help you track student engagement and activity in vUWS.
How do I start tracking student interaction with content and student engagement in vUWS?
This module will provide you with all the basic information about the tools that are available in vUWS to help you track student interaction with content and student engagement in vUWS.
