
Evaluating Your Subject
What is it?
There are many types of data that you can use to evaluate your unit. Data from vUWS learning analytics reports is only one type. Others include SFU data, the Grade Centre, peer review, historical data, tutor and anecdotal feedback.
Before you start evaluating your vUWS site using the vUWS learning analytics reports, review the behavioural metrics that can be established using the reports.
How do I do it?
The reports can be accessed from the menu on the left hand side by clicking on the Evaluation section. These are some of the main reports currently available and these are organised around their chronological relevance.
These reports can help establish an indication of behavioural engagement in your unit but there are, of course, other types of student engagement. Cognitive and affective engagement are the other two main types of student engagement in a teaching and learning context.
Steps for evaluating your unit
Step 1. Get the basics right
Ensure that there is an alignment between learning activities, learning materials and assessment tasks (constructive alignment). Additionally, it is important that your vUWS site is navigationally coherent and that all instructions for students are clear.
Step 2. Establish behavioural metrics
Use the reports to establish behavioural metrics. To do this, you firstly have to be clear about your questions. Scenario 1 is an example.
Scenario 1
I am concerned with the lack of focus in tutorial sessions. I am interested in seeing how many students have accessed (and viewed) the lecture prior to coming to tutorial sessions.
To establish an evaluation design for this question/scenario:
- What is your focus? Is it one lecture or a series of lectures?
- Establish the behavioural metrics for the video/videos (e.g. is it number of accesses? Or viewing ‘spikes’ in material?)
- If you want to start tracking cognitive engagement with your video material one way is to embed quizzes in your videos.
A worked example for scenario 1
Establish behavioural metrics for your video material (Panopto)
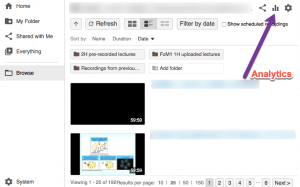
Go into your Panopto Recordings folder and click on the analytics icon in the top right hand corner.
Establish a global view of views and downloads
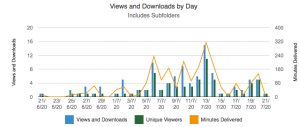
This will provide you with a range of options one of which is a global graph of views and downloads for the content in your video subfolder.
Determine metrics for individual videos
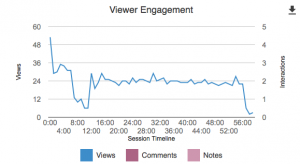
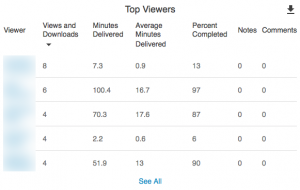
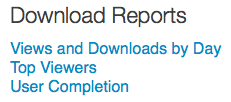
The tool enables you to analyse the behavioural engagement for individual videos, explore individual student engagement and to download these views as Excel spreadsheets.
Analyse viewing spikes
Each student’s behavioural engagement with the video material can be explored.
