
Course at-a-Glance Dashboard
Overview
The Course at-a-Glance Dashboard in vUWS provides insights on the student activity within a vUWS site. The data is visualised to help identify features, trends and patterns in the data which are relevant to teaching and learning. Clear actionable insights are presented including alerts, interpretation of the specific data and the ability to contact students.
Examples of questions that this dashboard can answer include (but not limited to):
- Which students have not logged into my vUWS site in the last 7 days?
- Have all students accessed my Module 1 material?
- How active are my students compared to the previous weeks?
- What are the patterns of student activity within my vUWS site?
- Are students more active in my subject compared to other subjects in my school?
How do I use the report?
Access the report
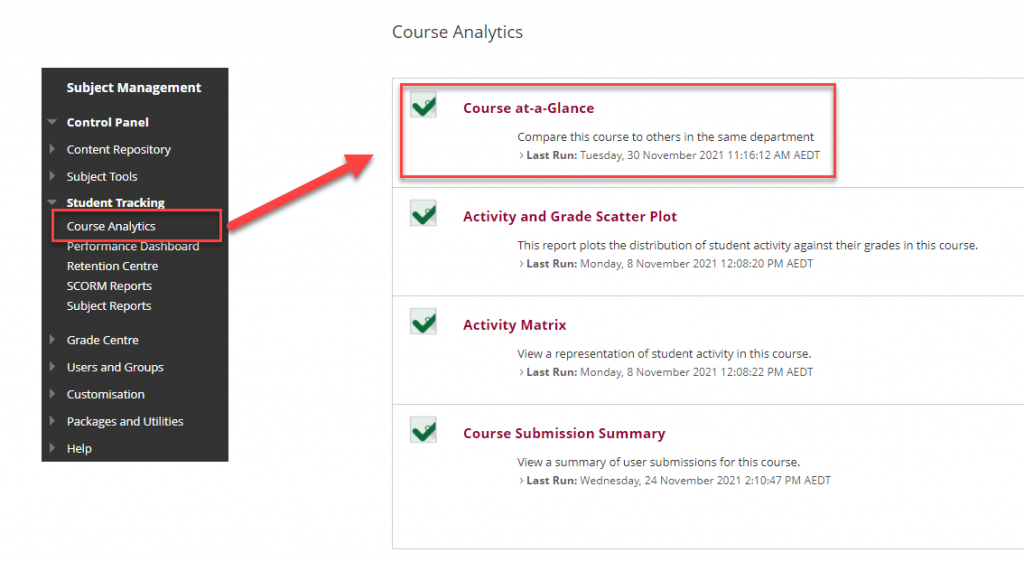
Access the Course at-a-Glance Dashboard in your vUWS site by scrolling down to the Subject Management section in the navigation menu, then selecting Student Tracking and Course Analytics .
A list of available reports will display. The first report in the list should be the Course at-a-Glance dashboard. Click on the text to run the report or hover your mouse cursor over the text then click on the chevron menu icon that appears and select Run.
A new browser tab will open which will contain the report which on this page will be called Course at-a-Glance .
Using the Interface and viewing Data
The interface is divided into 4 main elements which are indicated on the screenshot and described below:
- Report Toolbar
- Header
- Navigation bar
- Content area
Use the interactive hotspot image below to explore each element on the interface:
Report Pages
There are six report pages available in the dashboard, a summary of each page is provided in the bullet points below. For more detail, see the interactive book below.
- Home : A snapshot of the subject activity from the last 7 days with a comparison to the previous 7 days. It also provides access to the Content Item Engagement report.
- Subject Login Report : Student login data, including a summary of logins and granular data listing specific students who have and have not logged in. Instructors can generate an email for those who have not logged in from this page. The date range may be customised by the instructor to support a wider range of applications of this data.
- Subject Activity : An overview of the semester providing a visualisation of the weekly student activity data and a calculated trend line. Popular days and hours of access are also provided.
- Student Activity : A high-level view of the cohort activity and a list of individual students their activity summary.
- Compare to School : A comparison of the number of items contained on the vUWS site and student activity with the school averages.
- Content Item Engagement Report : A detailed breakdown of student clicks/accesses for each item contained on the vUWS site. The data can be drilled down on to provide a more granular view, including which students, when and how many times an individual student has accessed an item. Instructors can generate an email for those who have not accessed an individual item.
Use the interactive book below to explore each report page in more detail. Navigate to each report page using the menu on the left.
