All User Activity inside Content Areas
Overview
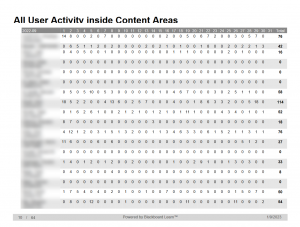
The All User Activity inside Content Area report shows the breakdown of hits (accesses) in the Content Areas of the vUWS site. A Content Area is defined as the folders in the left-hand navigation menu. The report provides the number of hits per Content Area, a breakdown of the number of times individual students have accessed each Content Area and the number of hits per day inside Content Areas.
Examples of questions that this report can answer include:
- What is the most popular Content Area that students access?
- Has a particular student accessed a Content Area?
- What patterns of access can be observed over time in the Content Areas?
How do I use the report?
Access the report
Access the All User Activity inside Content Areas report in your vUWS site by scrolling down to the Subject Management section in the navigation menu, then selecting Student Tracking and Subject Reports .
A list of available reports will display, the first report in the list should be the All User Activity inside Content Areas report. Hover your mouse cursor over the report heading text then click on the chevron menu icon that appears and select Run.
A new page will load where you are required to input the parameters of the report including:
- Format : The output file format which will be generated for the report. Formats include PDF, HTML, Excel and Word.
- Start Date : The date that you want to examine the access data from (Must not be over 180 days from the data of the report run – see note below)
- End Date : The data that you want to access the data to.
- Users : The students within your cohort that you would like to include in the report. Note: You can leave this box without selecting any students, and it will generate data for all the students. Otherwise, you can select particular students – hold down Ctrl to select multiple students – or click on any student and press Ctrl + A to select all students.
Note: The report only retains 180 days of historical data. This means that you cannot view data older than 180 days and the selection of dates should be within the 180 days range from the date of the report run.
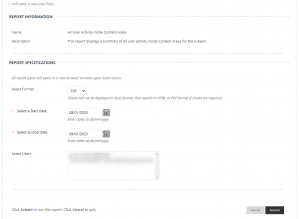
Once you are satisfied with you parameters, click on the Submit button down the bottom right of the page.
The report will be generated and will automatically open in a new window. Be aware, most browsers will block the popup so you will need to allow it. Alternatively, click on the Download Report link to access it. You also have the option to save the report for later using the Save to Content Collection or Download Report links.
Using the Interface and viewing Data
The report generates a static view of the data which is broken into four sections (See screenshots below):
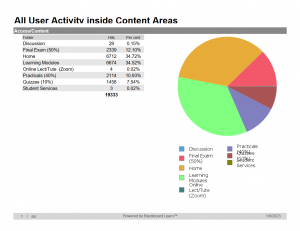
- An overview of the hits per Content Area
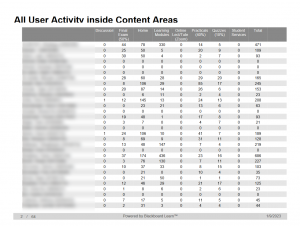
- A table which contains a list of all students and the number of hits per Content Area
- A column chart with the total number of hits per date
- A table per calendar month, each which contains a list of all students and the number of hits per calendar day
As this is a static report, there is no ability to interact with the data, including basic functions such as filtering it, drilling down on it, comparisons or aggregation. To enable any manipulation or further analysis of the data, it is highly recommended to download the data into an Excel format.
1. Overview of the hits per Content Area
2. Number of hits per Content Area by all students
3. Total number of hits per date
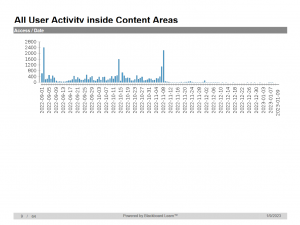
4. Number of hits per calendar day by each student