Activity & Grade Matrix
Overview
The Activity and Grade Matrix report in vUWS displays a visual representation of the relative grade score and activity level within vUWS for each student compared to the cohort. The report displays the overall grade and activity position, and a weekly breakdown for each student in the cohort. Examples of questions that this dashboard can answer include:
- What patterns can be observed based on the student activity and student performance?
- What is the activity/grade profile for my students?
How do I use the report?
Access the report
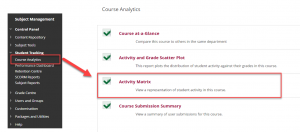
Access the Activity and Grade Matrix report in your vUWS site by scrolling down to the Subject Management section in the navigation menu, then selecting Student Tracking and Course Analytics .
A list of available reports will display, the second report in the list should be the Activity Matrix report. Click on the text to run the report, or hover your mouse cursor over the text then click on the chevron menu icon that appears and select Run.
A new browser tab will open which will contain the report which on this page will be called Activity & Grade Matrix .
Using the Interface and viewing Data
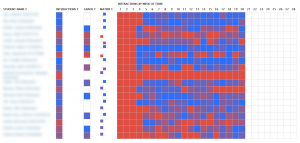
The report generates a table with the visual representation of the relative grade score and activity level within vUWS for each student compared to the cohort. The report displays the overall grade and activity position, and a weekly breakdown for each student in the cohort.
The relative comparison between students enrolled in the subject is accomplished using statistical deciles, which divide the activity and grade data into 10 equal parts, the results of which are displayed graphically using a heat map colour scheme – as seen in the image below.
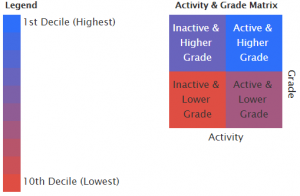
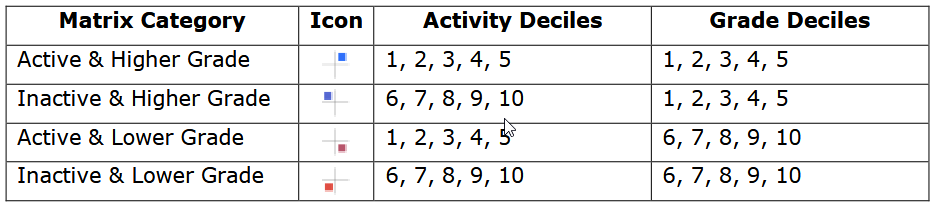
Students are also assigned a “matrix” classification based on their relative activity and grade decile values, which provides a generalisation of a student’s activity and grade profile in a subject. The matrix categories are as follows:
The result is a the Activity & Grade Matrix which provides a listing of all the students with their relative interactions score, grade score, matrix category and weekly activity/grade level within the subject compared to the cohort.
Clicking on an individual student name will load the Student at-a-Glance Summary report. This report displays engagement data for an individual student and compared it to other students enrolled in the same subject.