Activity and Grade Scatter Plot
Overview
The Activity and Grade Scatter Plot report in vUWS correlates the activity data and grade data from students within a vUWS site and plots it as a scatter chart. The data drawn on is the Grade Centre column marked as the “External” grade. It is useful to explore the relationship between students’ activities and their final score. Examples of questions that this dashboard can answer include:
- Is there a correlation between student activity and student performance?
How do I use the report?
Access the report
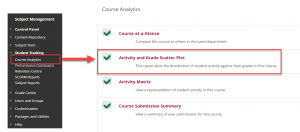
Access the Activity and Grade Scatter Plot report in your vUWS site by scrolling down to the Subject Management section in the navigation menu, then selecting Student Tracking and Course Analytics .
A list of available reports will display, the second report in the list should be the Activity and Grade Scatter Plot report. Click on the text to run the report, or hover your mouse cursor over the text then click on the chevron menu icon that appears and select Run.
A new browser tab will open which will contain the report which on this page will be called Unit Access & Grade Scatter Plot .
Using the Interface and viewing Data
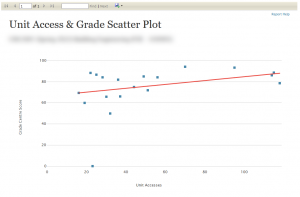
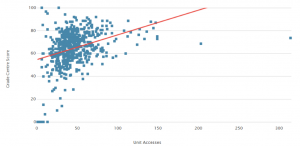
The report generates a scatter plot which plots the student grade against the student activity – the external/total column from the Grade Centre is used. The blue dots represent individual student s and the red line is a line of best fit. Moving the cursor over a dot will reveal the respective student’s name and student ID.
It is possible to click on an individual dot, which will then load the Student at-a-Glance Summary report. This report displays engagement data for an individual student and compared it to other students enrolled in the same subject.
In the two examples below , the upwards trajectory of the slope indicates that there was a relationship (for this unit) between access and grades.